19.08.2015
The CSD Design Business Survey Results Q2 2015
The Chartered Society of Designers conducts quarterly design business surveys to inform the profession and interested stakeholders as to the trends across a range of issues concerning design businesses. The surveys provide key findings from indicators in areas such as investment, employment, growth and turnover showing changes, current attitudes and future considerations.
The CSD quarterly surveys provide feedback on important issues concerning the design industry today. The findings of each survey are published in TheDesigner and on the CSD website with comparative data showing the latest trends. The data will also feed into our regular business meetings with The Bank of England at which we represent the interests of the design sector.
NB: Bracketed figures show the results from the previous surveys.
PARTICIPANTS
Are you a member of The Chartered Society of Designers?
The survey is conducted across the design sector with responses gathered from CSD members and non-members, the proportion of respondents in the non-members group has been steadily increasing. In Q2 29% (Q4 2014: 16%, Q1 2015: 18%) of participants were non-members which is welcome news that the survey is reaching a wider audience.
We have also seen a 36% increase in the number of respondents for the most recent survey compared to the first survey in Q4 2014.
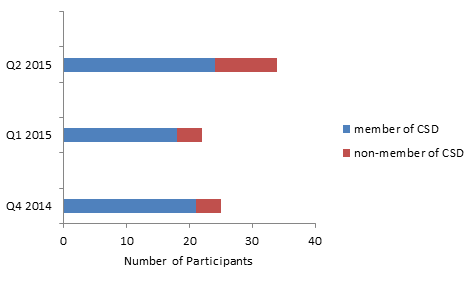
The graph shows the total number of participants that took part in each survey identifying members and non-members.
DESIGN BUSINESS ACTIVITY
What is the main design activity of your business?
The greatest response in Q2 2015 was from 21% (Q4 2014: 4%, Q1 2015: 10%) of businesses that practiced industrial design, the second most prevalent was a tie between architecture 18% (Q4 2014: 0%, Q1 2015: 5%) and interior design 18% (Q4 2014: 19%, Q1 2015: 0%).
Previous surveys showed the majority of respondents identifying graphic design (Q4 2014: 31%, Q1 2015: 19%) and branding (Q4 2014: 12%, Q1 2015: 33%) as their main design activity. The proportion of respondents from these sectors remained popular both at 15% this quarter.
| Q4 2014 | Q1 2015 | Q2 2015 |
| 1. Graphic Design (31%)
2. Interior Design (19%) 3-4. Branding (12%) & Fashion Design (12%) 5. Design Consultancy (8%) |
1. Branding (33%)
2. Graphic Design (19%) 3-6. Design Consultancy (10%) & Industrial Design (10%) & Digital Design (10%) & Service Design (10%) |
1. Industrial Design (21%)
2-3. Architecture (18%) & Interior Design (18%) 4-5. Graphic Design (15%) & Branding (15%) |
The table shows the top 5 design activities of respondents to each of the surveys.
EMPLOYMENT
How many people does your company currently employ?
By far the greatest response was from 63% (Q4 2014: 67%, Q1 2015: 56%) of businesses with 10 or less employees and of this group 47% (Q4 2014: 54%, Q1 2015: 44%), employed between 1-5 people. This is to be expected given the nature of the design sector which comprises mainly of micro businesses and small teams or individuals.
It is important to note that the design industry has (and has always had) a significant freelance workforce. A study by the ‘Professional Contractors Group’ estimates that there are 1.4 million British freelancers working across all sectors, this reflects growth of 14% in the past decade. These results are supported by a report from ‘Elance’ which shows that 87% of graduates with first or second class degrees say they find freelancing to be a ‘highly attractive and lucrative career option’. Furthermore, 21% of graduates with first class honours say they have already chosen to work as a freelancer suggesting that this freelance economy will continue to gather pace in the UK.
FUTURE EMPLOYMENT TRENDS
Within your company, over the next 12 months how do you expect employment numbers to change in the following groups?
Key findings from the Department for Culture Media and Sport (DCMS) show that employment in the creative economy has increased from 1.81m to 2.62m jobs between 1997 and 2013. This is equivalent to a rise of 2.3% each year, around four times greater than 0.6% increase in other areas of the UK Economy.
The British Chambers of Commerce Quarterly Economic Survey Q2 2015 results showed that within services 30% of companies in the services industry are expecting their workforce to increase over the next 3 months.
For designers, the average results across different experience levels show our results to be in line with these surveys. Of our respondents 36% were expecting an increase, 63% no change and 1% a decrease in employee numbers of designers. This suggests that the majority of companies are primarily looking to maintain their current levels of employment but that there is scope for optimism given the expected increase in designer employment.
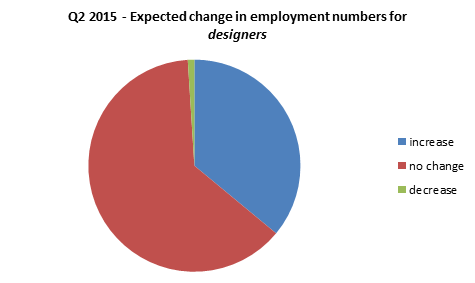
The chart shows the expected changes in employment levels for designers over the next 12 months.
A further breakdown of changes within employee numbers with different experience levels can be seen below.
Graduates
For designers at entry level positions 64% (Q4 2014: 50%, Q1 2015: 50%) of participants expected employment numbers to stay the same. The remaining 36% (Q4 2014: 45%, Q1 2015: 50%) expected an increase in the number of employees in this group.
Middle Weight
The majority of participants, 63% (Q4 2014: 59%, Q1 2015: 69%) expected employment numbers for middle weight designers to stay the same. Of the remaining respondents 33% expected an increase (Q4 2014: 36%, Q1 2015: 31%) and 4% a decrease (Q4 2014: 5%, Q1 2015: 0%) in employee numbers in this group.
Senior
Expectations for employment of senior designers followed a similar pattern. 62% (Q4 2014: 96%, Q1 2015: 80%) expected no change and the remaining 38% (Q4 2014: 4%, Q1 2015: 20%) expected an increase in employee numbers in this group.
Non-designers
For non-design employees (including management, admin/sales and other) the results showed 81% (Q4 2014: 92%, Q1 2015: 68%) expecting no change in employment numbers, 18% (Q4 2014: 5%, Q1 2015: 30%) an increase and 1% (Q4 2014: 3%, Q1 2015: 2%) a decrease.
This suggests that employers are planning to maintain their current employee numbers for other employee groups, but that employment growth will occur in design practice.
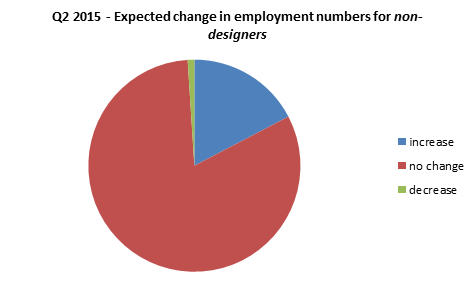
The chart shows the expected changes in employment levels for non-designers over the next 12 months.
PAY EXPECTATIONS
What are your expectations for average employee pay over the next quarter?
With regard to pay expectations, the results were split evenly 50% (Q4 2014: 58%, Q1 2015: 39%) of participants expected no change in average employee pay over the next quarter and the other 50% (Q4 2014: 38%, Q1 2015: 61%) expected an increase in average pay.
Of those expecting an increase in pay for employees, 47% (Q4 2014: 33%, Q1 2015: 45%) anticipated a rise between 1 – 2%. Surprisingly, some 20% (Q4 2014: 11%, Q1 2015: 9%) of these respondents were expecting to see pay increase by 5% or more.
The UK’s creative sector is estimated to be worth £71 billion in 2015, its value has increased by 15.6% over the past eight years. In 2013 the creative sector grew faster than any other UK industry and the DCMS reported that 1 in 11 of all UK employment is in a creative role.
The ‘major players salary survey’ revealed that in 2013 overall salaries for creative professionals remained strong, rising above inflation, with 59% of survey respondents reporting an increase in their pay. 1 in 5 permanent professionals achieved a promotion, suggesting the retention of creative employees is a priority for many companies.
With many policy makers focusing on growth and investment in the design sector and demand at a high in the creative industries, we predict that designers can expect stability in employment with healthy prospects of rises in salaries.
RECRUITING CONCERNS
If recruiting, do you consider any of these factors to be of concern?
Skills have remained a prime concern in all of our surveys to date and continue to be a concern for 89% of respondents this quarter (Q4 2014: 100%, Q1 2015: 88%).
Interestingly, the Q2 2015 results showed that a much greater proportion of participants felt salaries were a concern 43% (Q4 2014: 32%, Q1 2015: 25%) compared to previous results reflecting employers expectations of increases in pay.
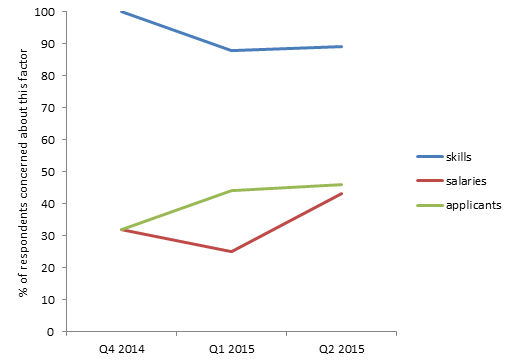
The chart shows the changes in the proportion of respondents who felt each factor was a concern compared to past surveys.
SKILLS SHORTAGE
Do you consider there to be a skills shortage within these groups of designers?
The creative industries are ‘graduate rich’ with estimates from the CBI suggesting 16% of all university students are studying courses relevant to the creative economy. The issue in many areas of the creative industry is not the quantity of graduates but the business relevance of the courses they studied.
With rapid technological change and the requirement of job-specific technical skills, there is evidence to suggest that employers have indicated the content of university courses cannot keep up with their needs.
In the creative industries, strong business-university collaborations can help to ensure the content of degrees stays relevant and building successful relationships will help to match the delivery of training to business needs. CSD takes a leading role in this approach with projects such as the Course Endorsement Programme facilitating interaction between industry and universities and from ‘learning to earning’™.
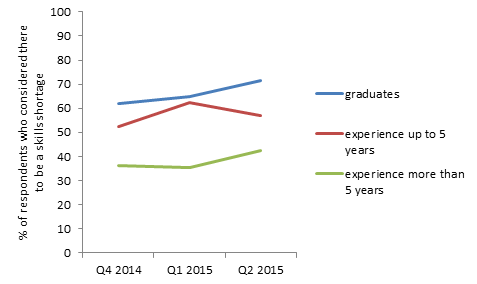
The chart shows the percentage of respondents who considered there to be a skills shortage within each group of designers compared to past surveys.
Of our respondents, this quarter 71% (Q4 2014: 62%, Q1 2015: 65%) considered there to be a skills shortage among graduates. These findings are consistent across numerous surveys over the past few decades.
Some 57% (Q4 2014: 52%, Q1 2015: 63%) of respondents considered there to be a skills shortage for designers with up to 5 years of experience. This could be the result of the skills shortage identified in graduates as they progress through their careers. This is where CPD and relevant training programmes will play a key role in developing skills to fill these gaps.
For designers with more than 5 years of experience, the skills shortage was still evident, as identified by 42% (Q4 2014: 36%, Q1 2015: 35%) of participants.
INVESTMENT
Will you be investing in the following areas of your business over the next 12 months?
The areas in which the majority of survey participants said they would increase investment over the next 12 months were equipment, training, promotion and staff.
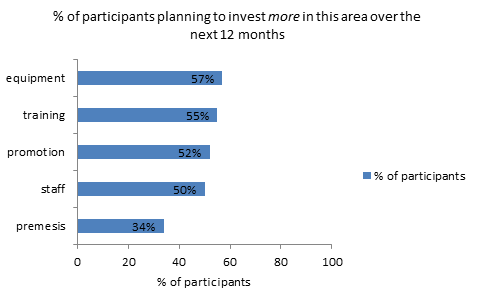
The chart shows the percentage of respondents who plan to invest more in each area over the next 12 months.
Some 57% (Q4 2014: 58%, Q1 2015: 56%) of respondents said they will invest more on equipment over the next 12 months, 55% (Q4 2014: 21%, Q1 2015: 78%) plan to invest more on training, 52% (Q4 2014: 25%, Q1 2015: 56%) expect to invest more on promotion and 50% (Q4 2014: 46%, Q1 2015: 56%) will invest more in staff.
Having identified skills shortages as an important issue among the design industry, it is comforting to note that more than 50% of respondents plan to increase the amount they invest in staff and their training over the next 12 months.
DESIGN FEES
What your expectations are in regards to design fees over the next 12 months?
Reflecting the changes in salary expectations, it is not surprising to see that 59% (Q4 2014: 33%, Q1 2015: 61%) of survey participants plan to increase their fees over the next 12 months. Within this group of respondents the majority 47% (Q4 2014: 13%, Q1 2015: 27%) expect to increase fees by 3-5%.
GROWTH
How do you expect growth to change over the next 12 months?
Optimistically, some 66% (Q4 2014: 39%, Q1 2015: 56%) of respondents expect growth to be higher over the next 12 months, a 10% increase from the previous survey. This positive shift could be a reflection of the anticipated increases in employment and investment shown in our research.
As noted by the UKTI inward investment report, despite a general slowdown of FDI (Foreign Direct Investment) flows during 2014-15, the UK creative industries increased FDI by 50%. The UKs stock of FDI has passed the £1trillion mark, underlining the UK’s position as ‘the inward investment capital of Europe’.
The UK creative industry generated a record GVA (Gross Value Added) of £76.9 billion in 2013, growing faster than any other industry. Creative industries now accounts for around 5% of total GVA in the UK, the highest ever share.
In 2014 government and industry partnered to develop an ambitious strategy to develop the creative industries in the UK and abroad by 2020, this project was launched as part of ‘Create UK’. In addition to this a number of initiatives have been introduced to create new jobs in the creative economy. These include a proposal from Nesta innovation charity which has developed recommendations to create 1 million new creative jobs by 2030.
DEMAND
How do you expect UK and export demand to change over the next 12 months?
The UK has the second largest design sector in the world and design accounted for £131 million of services exported in 2011. In 2012, DCMS reported that 8.8% of all UK exports were from the creative industries.
UK Demand
The results of the Q2 2015 survey revealed that the majority, 59% (Q4 2014: 45%, Q1 2015: 39%) of respondents are expecting UK demand to be higher over the next 12 months. This is a 20% increase from the previous quarter’s results.
Export Demand
In relation to export demand over the next 12 months, 38% (Q4 2014: 29%, Q1 2015: 41%) of respondents expected an increase, and the majority of participants, 58% (Q4 2014: 57%, Q1 2015: 53%) expected no change.
CONFIDENCE
Compared to the previous quarter how is your overall business confidence?
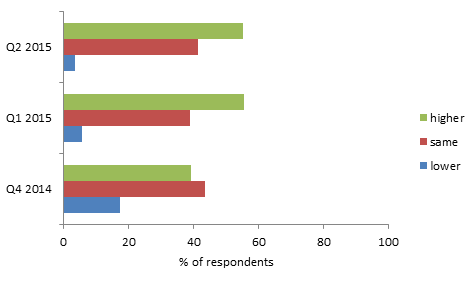
The chart shows the business confidence levels of participants compared to previous surveys.
The recent results revealed that 55% (Q4 2014: 39%, Q1 2015: 56%) of respondents reported that their confidence was higher this quarter compared to the previous quarter.
The proportion of participants who reported lower levels of business confidence this quarter was only 3% (Q4 2014: 17%, Q1 2015: 6%), in comparison to the Q4 2014 results this is a reassuring development.
The remaining 41% (Q4 2014: 43%, Q1 2015: 39%) reported no change in confidence levels.
|
|